Performance Tools
LLMs for Automated GPU Performance Analysis
Utilizing GPU-based supercomputers effectively requires writing computational kernels that execute efficiently on GPU hardware as well as efficiently orchestrating data movement between the CPU and GPU memory resources available on heterogeneous node architectures. Given the size and complexity of large-scale simulation software, optimizing each computational kernel across the application by hand to the greatest extent possible is not feasible in any realistic timeline. Meanwhile, as new GPU architectures with new features are released, tedious optimization efforts may need to repeated with each new GPU generation to utilize all the latest performance improvements. Even with significant time invested in optimizing a single compute kernel, it remains challenging for developers who are not experts in GPU hardware architecture, runtime systems, and compilers to successfully identify and implement possible optimization techniques.
Existing literature attempts to address this problem by creating tools which automate diagnosis of performance bugs in GPU kernel code, but these are limited in how well they can apply to higher-level portable programming models. Additionally, automatically diagnosing a performance bug is helpful, but in many cases successfully implementing a fix for an identified optimization candidate still requires substantial manual effort as well as expert-level understanding of the hardware architecture. With these challenges in mind, we are leveraging large language models (LLMs) in agentic frameworks to automatically modify and generate efficient GPU kernel code. These efforts will substantially reduce the effort required to bring scientific applications to maximum performance on exascale systems and improve the productivity of scientific application developers.
Hatchet
Hatchet is a Python-based library that allows Pandas DataFrames to be indexed by structured tree and graph data. It is intended for analyzing performance data that has a hierarchy (for example, serial or parallel profiles that represent calling context trees, call graphs, nested regions’ timers, etc.). Hatchet implements various operations to analyze a single hierarchical data set or compare multiple data sets, and its API facilitates analyzing such data programmatically. Our ProTools and SC papers provide more information on Hatchet’s design and features [1, 2].
Pipit
Pipit is a Python-based library designed for parallel execution trace analysis, built on top of the Pandas library. It supports various trace file formats such as OTF2, HPCToolkit, Projections, and Nsight, providing a uniform data structure in the form of a Pandas DataFrame. Pipit provides a range of data manipulation operations for aggregating, filtering, and transforming trace events to present the data in different ways. Additionally, it includes several functions for easy and efficient identification of performance issues. Our SC poster provides more information on Pipit’s design and features [3].
Comparison of Call Graph Generation by Profiling Tools
Analyzing and optimizing the performance of parallel programs is critical to obtaining high efficiency on high performance computing (HPC) architectures. The complexity in hardware architectures and system software makes measuring and recording performance data challenging. Even so, a plethora of profiling tools exists for gathering and analyzing performance data. These profiling tools generate call graphs, which provide critical information about the program structure to analyze the performance of a program.
In our ISC paper, we compare several popular tools that are used in the HPC community – Caliper, HPCToolkit, Score-P, and TAU in terms of their runtime overheads, memory usage, and the size, correctness and quality of the generated call graph data [4]. We conduct experiments on a parallel cluster by profiling three different proxy applications, AMG, LULESH, and Quicksilver, using both instrumentation and sampling under different sampling intervals and different numbers of processes. In order to analyze callpaths, we used and improved Hatchet, which is a performance analysis tool we develop in our group.
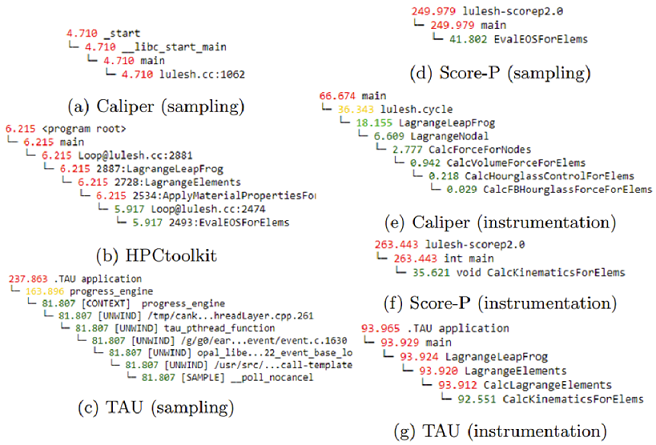
The above figure shows the callpath of the second slowest node generated by each tool using sampling and/or instrumentation. As can be seen, each tool usually identifies a different node as the second slowest, and in some cases, although the identified second slowest node is the same, its call path is different for different tools (e.g. Score-P instrumentation and TAU instrumentation).
For more details such as the methodology and evaluation for comparing runtime overhead, memory usage, and the size, correctness, and quality of the generated call graph data please see “Comparative Evaluation of Call Graph Generation by Profiling Tools” [4].
Related Publications
[1] Stephanie Brink et al, "Usability and Performance Improvements in Hatchet", Proceedings of the Workshop on Programming and Performance Visualization Tools. November 2020
[2] Abhinav Bhatele et al, "Hatchet: Pruning the overgrowth in parallel profiles", Proceedings of the ACM/IEEE International Conference for High Performance Computing, Networking, Storage and Analysis, November 2019
[3] Alexander Movsesyan et al, "Pipit: Simplifying Analysis of Parallel Execution Traces", Proceedings of the International Conference for High Performance Computing, Networking, Storage and Analysis, SC ’23, November 2023
[4] Onur Cankur et al, "Comparative Evaluation of Call Graph Generation by Profiling Tools", International Conference on High Performance Computing. Springer, May 2022